Hopeʼs Experiment: Anomaly of Water
Experiment number : 1942
Goal of experiment
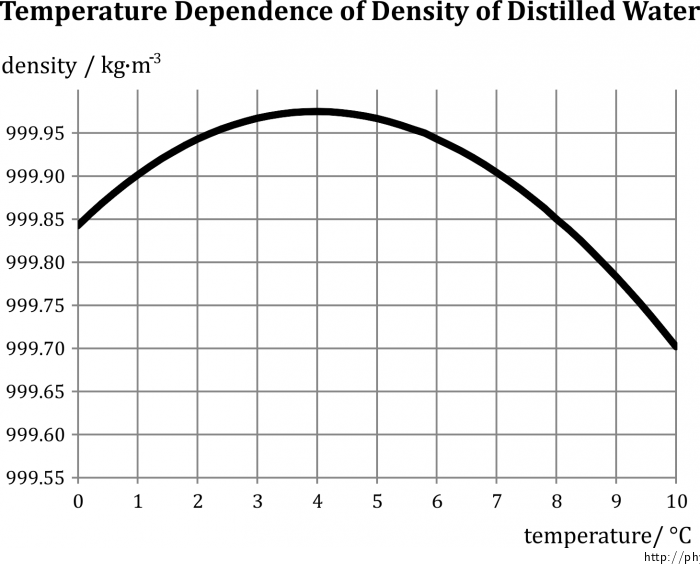
The goal of this experiment is to demonstrate that between the temperatures 0 °C and 4 °C, the density of water increases with increasing temperature. (To be exact: we are going to demonstrate that water has a higher density at 4 °C than at 0 °C.)
Theory: thermal volume expansion of liquids
The volume of liquids is, similarly to solids and gases, dependant on their current temperature. Liquids (with the exception described below) increase their volume with increasing temperature; the increase of their volume ΔV is, with some neglect, directly proportionate to increase of temperature Δt and the initial volume V0. This relation can be mathematically denoted as
\[\Delta V\,\doteq\,\beta V_0 \Delta t,\tag{1}\]where the constant β describes the volumetric thermal expansion coefficient and is a characteristic property of every liquid. (The neglect mentioned above limits the validity of this relationship to “small” differences in temperature, where βΔt≪1.). The volume of the liquid V after heating is therefore equal to the sum of its initial volume Vo and the growth ΔV given by relationship (1):
\[V\,\doteq\,V_0\,+\,\beta V_0 \Delta t\,=\,V_0(1\,+\,\beta\Delta t). \tag{2}\]Relationship (2) can be expanded using mass and density:
\[\frac{m}{\rho}\,\doteq\,\frac{m}{\rho_0}(1\,+\,\beta\Delta t), \tag{3}\]which can be simplified to:
\[\rho\,\doteq\,\frac{\rho_0}{1\,+\,\beta\Delta t}.\tag{4}\]The result is logical and predictable – if the volume of a liquid increases with increasing temperature, its density (while conserving mass) necessarily decreases.
Theory: anomaly of water
The constant β used in the relationships above is itself dependent on temperature; this dependence is usually very small. In the case of water, however, β has negative values in the narrow range between 0 °C and 4 °C. Heating water inside this interval therefore leads to a decrease in volume, or an increase in density. This phenomenon, unobserved in other liquids, is often referred to as the anomaly of water.
The volume of water is then apparently minimal (and the density maximal) at approx. 4 °C; exceeding this temperature leads to the values of β becoming positive again and a subsequent increase in temperature causes an increase in volume (decrease in density), in agreement with the general theory.
The dependence of (distilled) water on temperature is illustrated by Fig. 1.
Tools
Hope’s device, two thermometers (two sensors connected to a computer, which can plot the development of temperature in time; useful, though not necessary. In this experiment, two identical Vernier Go!Temp sensors were used.), crushed ice, kitchen salt, two large beakers (or other containers, preferably 500 ml or bigger).
Hope’s device
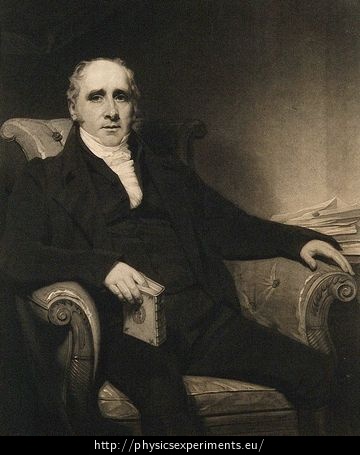
A simple device demonstrating the anomaly of water was designed in 1805 by Scottish scientist Thomas Charles Hope (1766-1844), among others the discoverer of strontium. The picture below (Fig. 2) is taken from Wikipedia.
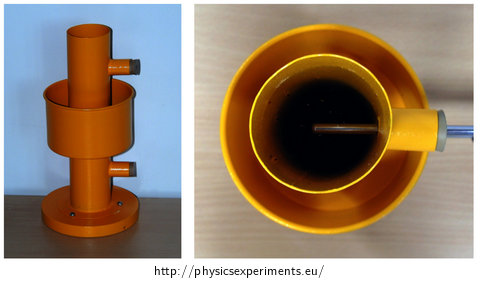
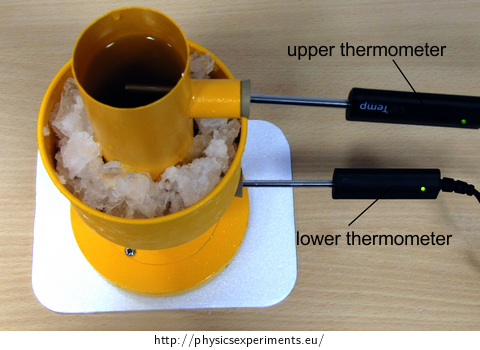
The body of the device (Fig. 3) consists of a hollow cylinder, which is filled with water and allows two thermometers to be inserted at different heights through two holes on the side. In the half of its height, the cylinder is fitted with an outside reservoir for a cooling mixture. This reservoir is in no way connected to the inside of the cylinder.
Procedure
At least one hour before conducting the experiment, we fill one beaker with water and put it into a fridge. We do the same with an empty Hope's device. This way, we will precool the necessary parts of the experiment.
Right before the experiment itself, we prepare the cooling mixture using crushed ice and kitchen salt; the procedure is described in detail in the experiment Cooling Mixture of Water, Ice and Salt. It is appropriate to have a thermometer to control the temperature of the mixture.
After a thorough cooling we take Hope’s device out of the fridge, isolate it from the pad (e.g. with a styrofoam plate) and insert the thermometers into both holes.
We pour the precooled water into the inner cylinder. The thermometers should now show the same temperature. If a measurement in time is available, we start it now.
Now we fill the reservoir with the cooling mixture (Fig. 4). After that we simply observe the development of temperatures measured by both thermometers.
Sample result
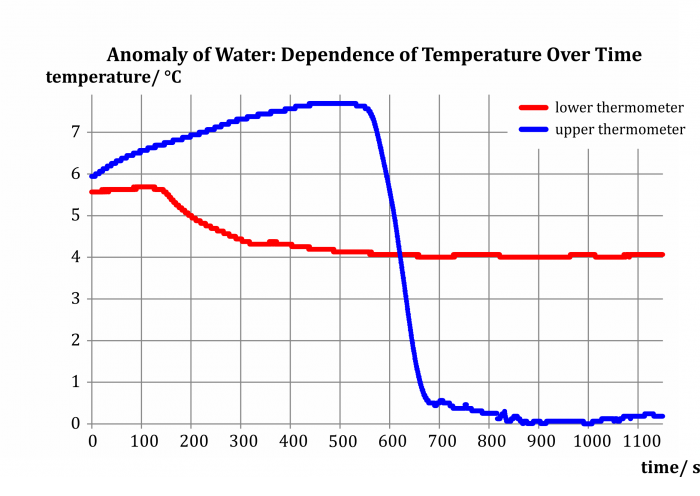
The experiment results in two dependencies of temperature of water in the inner cylinder on time (Fig. 5), blue for the upper thermometer (t1) and red for the lower thermometer (t2). Let us now analyze their shape.
In the beginning of our measurement, before the addition of the cooling mixture, both temperatures are similar, in our case between 5.5 °C and 6.0 °C; the better the water is stirred, the smaller the difference we can expect.
After adding the cooling mixture, the water cools down in the middle of the cylinder, increases its density and sinks to the bottom – the lower section of the cylinder fills up with cold water and the temperature t2 decreases, whereas t1 slowly increases thanks to being heated by the surrounding air.
The situation changes when the lower half of the cylinder fills up with water at approx. 4 °C, which reaches its maximal density at that point. Subsequent cooling of water to temperatures lower than 4 °C leads to a decrease in density – this colder water therefore accumulates in the upper half of the cylinder. Whereas the temperature t2 stabilizes around 4 °C, the temperature t1 rapidly decreases all the way to 0 °C.
Technical notes
Distilled water yielded better results.
It is absolutely imperative for the success of the experiment to let both the water and the body of Hope’s device sufficiently cool down in advance (we recommend a temperature of around 6 °C). Otherwise, it is possible that we will not be able to sufficiently cool down the water (i.e. under 4 °C) inside the cylinder even with a large amount of colling mixture.
When preparing the cooling mixture (the procedure is described in detail in the experiment Cooling Mixture of Water, Ice and Salt), you should use a lot of crushed ice and salt – the mixture should completely fill the reservoir on the circumference of Hope’s device. In general, it is advised to prepare a larger amount of the cooling mixture and add more into the reservoir in case the experiment runs slowly.
We cannot stir the water in the inner cylinder after adding the cooling mixture inside the reservoir! This would drastically disrupt the course of the experiment.
A layer of ice can form on the inside walls of the cylinder at th height where the reservoir is placed.
It is necessary to thoroughly wash out Hope’s device after conducting the experiment, most importantly clean all the salt! If pieces of salt were to get into the inner cylinder, they would mix with water during subsequent experiments, forming a solution with density and melting point not corresponding to the properties of clean water! (E.g. we can expect such a solution to decrease its temparature as a liquid even below 0 °C.)
Pedagogical notes
If we want to liven up the lesson and let the students be active, we can entrust them with preparing the cooling mixture.
The measurement itself takes approximately twenty minutes, during which it requires no intervention (with the exception of potentially adding more cooling mixture). This time can be used to for example make students familiar with the theory above, eventually with the consequences of the anomaly of water (ponds freezing from the surface etc.).
Visualisation through a thermal imaging camera
If we have a thermal imaging camera available, we can show that the inversion of temperature caused by the anomaly of water is measurable even on the outer surface of Hope’s device. Fig. 6 below shows an image taken with the thermal imaging camera FLIR i7 (emissivity ε = 0.95), on which Hope’s device is pictured from the side.

Whereas the shades of red depict places with temperature higher than 2 °C, the shades of purple depict places with lower temperature. It is apparent at first sight that we measure much higher temperature at the bottom of the cylinder than at its top.
Visualisation of Hope's experiment
Hope’s experiment is illustratively visualised and described in a video published on YouTube by the channel MBD Alchemie:
